

The answer to better housing affordability? Time.
Mortgage rates remain below historical averages, but elevated home prices continue to strain affordability
5 min read
KEY POINTS
- Federal Reserve decisions can influence mortgage rates, but inflation expectations and long-term Treasury yields often play a larger role.
- Mortgage rates have risen from pandemic-era lows but remain below their long-term historical average.
- Improving housing affordability will likely require a combination of slower home price growth, increased housing supply and gradual income gains over time.
Part of the interest in the decisions that the Federal Open Market Committee (FOMC) makes on monetary policy is the impact, tangential as it might be, on home mortgage rates. We say “tangential” as the rate decisions have the most direct impact on the short end of the Treasury curve, two-year notes and shorter. Meanwhile, the longer end of the Treasury curve is influenced by several factors—Fed decisions, yes, but more importantly, the expectations for inflation going forward. Longer-term bond investors are the most sensitive to Fed decisions, as changes in inflation are the key risk to the value of these investments.
We saw this dynamic at play after the most recent meeting of the Fed, the second meeting with Kevin Warsh as the new chairman. Their decision to keep rates the same resulted in shorter-term Treasury yields declining as the markets priced out the possibility of a rate increase, although the possibility of a rate increase in September is still there. The longer end of the Treasury curve, however, saw prices fall and yields rise as the market perceived an increasing risk of inflation moving higher as the Fed hesitates. Since long rates moved higher, so did 30-year home mortgage rates.
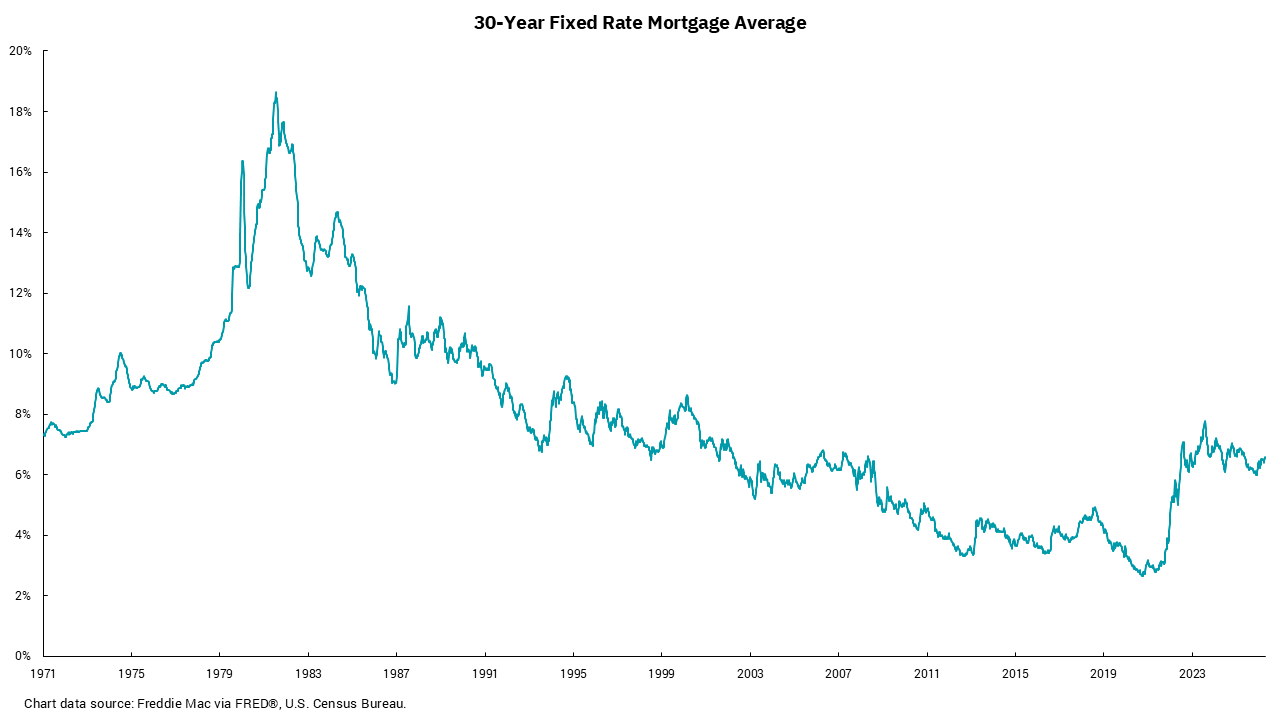
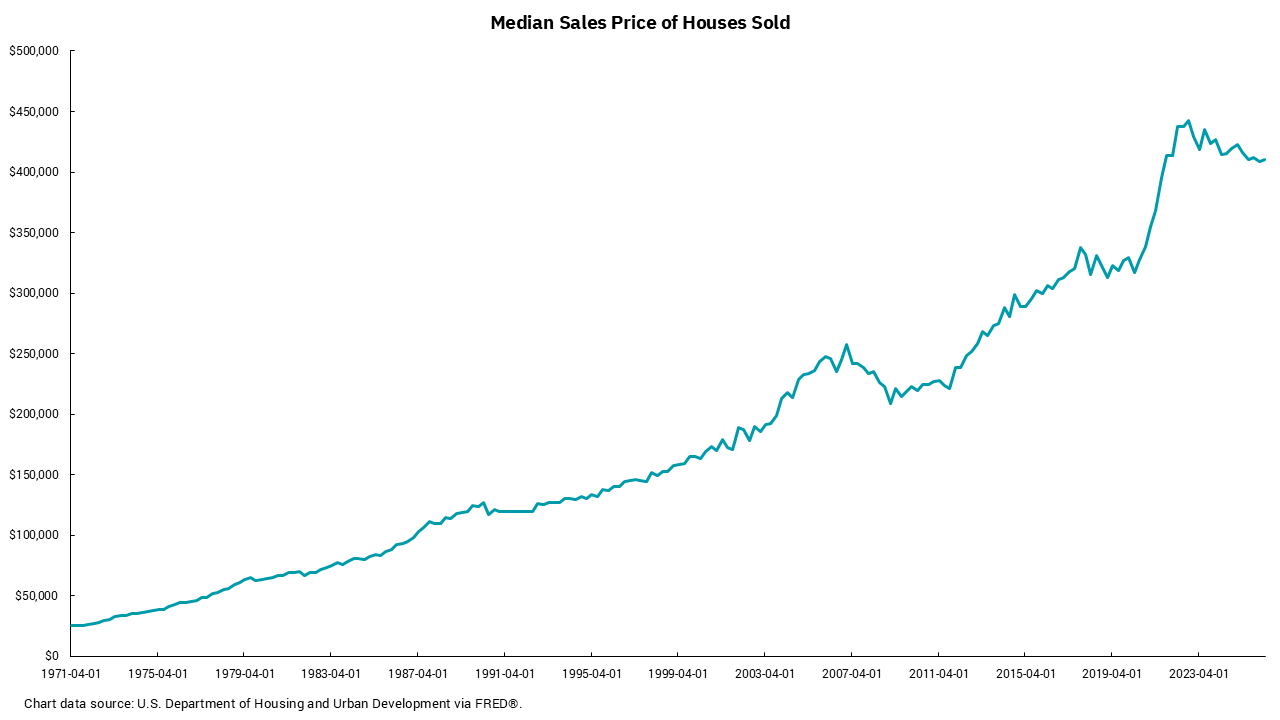
With this in mind, our charts this week focus on two of the main drivers of home affordability: rates and prices. Of course, personal incomes also play a role in the affordability equation particularly in terms of the rate of home price increases, as compared to personal incomes. In this regard, longer-term data shows home price “inflation” has exceeded wage gains over a similar period. However, here we are focusing on rates and prices because these factors reveal a major cause of the more recent affordability crisis.
The rate chart indicates that while mortgage rates are certainly higher than during the pandemic, they are not egregiously high compared to past periods. The most recent reading from Freddie Mac shows a rate of 6.73% nationally. The average rate over the period of the chart is 7.67%. I bought my first house in 1983 and felt fortunate to get a rate of 13.875%. However, prices were much lower in 1983, meaning that the mortgage payment I had, even at that rate, was more affordable. We can see the impact of higher rates towards the end of the price chart as home price appreciation has slowed considerably.
All this is to say that the solution to the affordability issue is complex. Lower prices would help affordability, but existing homeowners might be less than enthusiastic for the change. Lower rates could help affordability too, but only if supply were to increase enough to handle the additional demand. Without greater supply, prices would increase. The income part of the equation will just take time. If incomes were to rise rapidly, it would spur inflationary pressures and lead to even higher rates. Hence the answer is probably time to allow all the factors to move in a direction which helps but does not overly disrupt the current market.
Get By the Numbers delivered to your inbox.
Subscribe (Opens in a new tab)